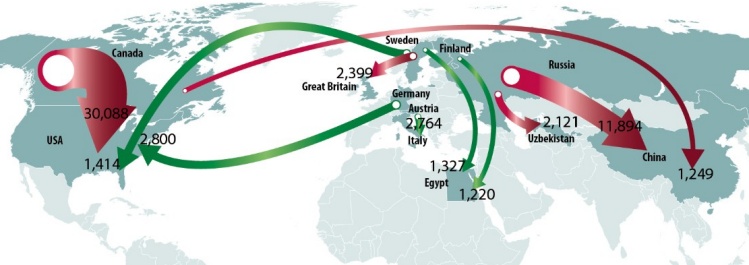
In 2022, softwood lumber exports from Canada to the US were once again the biggest global trade flow by far. With a total of 30.1 million m³, shipments decreased by 7% compared to 2021. Nevertheless, they were only slightly below the levels recorded in 2020 (30.8 million m³) and 2019 (30.3 million m³).
A much more substantial decrease can be seen in softwood lumber exports from Russia to China, which have been falling constantly in the years following 2019 (19.3 million m³) and totaled only 11.9 million m³ in 2022. This is according to data published by China Customs Statistics.
A newcomer on the podium of the world’s biggest softwood lumber trade flows is the one from Germany to the US. In 2022, Germany shipped 2.8 million m³ across the Atlantic, i.e. 21% more than in the year before. In 2019, exports amounted to 1.21 million m³ and in 2020, they totaled 1.86 million m³.
Softwood lumber exports from Austria to Italy are in fourth place with a trade volume of 2.76 million m³ and a recent 2% increase in Austria’s most important trade flow.
In addition to Germany, Sweden also shipped much bigger volumes of softwood lumber to the US. In 2022, they were up by 84% year on year, reaching a total of 1.41 million m³.
Further massive decreases were recorded in Canadian shipments to Asia. In 2019, Canada had still sold 4.56 million m³ to China, whereas last year, trade volumes fell by another 30% to 1.25 million m³. A negative trend can also be seen in Canadian exports to Japan, which were down by 26%, amounting to only 1.1 million m³ in 2022.
| Trade flows incl. planed timber in 1,000 m³ | |||||
| N. | Exporter | Importer | 1–12 2021 | 1–12 2022 | Diff. in % |
|---|---|---|---|---|---|
| 1 | Canada | USA | 32,218 | 30,088 | –7 |
| 2 | Russia | China | 12,932 | 11,894 | –8 |
| 3 | Germany | USA | 2,316 | 2,800 | 21 |
| 4 | Austria | Italy | 2,722 | 2,764 | 2 |
| 5 | Sweden | Great Britain | 2,756 | 2,399 | –13 |
| 6 | Russia | Uzbekistan | 2,134 | 2,121 | –1 |
| 7 | Sweden | USA | 770 | 1,414 | 84 |
| 8 | Sweden | Egypt | 867 | 1,327 | 53 |
| 9 | Canada | China | 1,789 | 1,249 | –30 |
| 10 | Finland | Egypt | 1,070 | 1,220 | 14 |
| 11 | Latvia | Great Britain | 1,419 | 1,129 | –20 |
| 12 | Canada | Japan | 1,484 | 1,095 | –26 |
| 13 | USA | Mexico | 945 | 1,007 | 7 |
| 14 | Brazil | USA | 931 | 1,004 | 8 |
| 15 | Sweden | Netherlands | 989 | 988 | 0 |
| 16 | Finland | China | 726 | 929 | 28 |
| 17 | Germany | Austria | 976 | 892 | –9 |
| 18 | Austria | Germany | 1,139 | 892 | –22 |
| 19 | Germany | France | 963 | 813 | –15 |
| 20 | Sweden | Norway | 1,036 | 808 | –22 |


