
Update: March 11, 11:17 a.m.
A trouble spot as lumber supplier
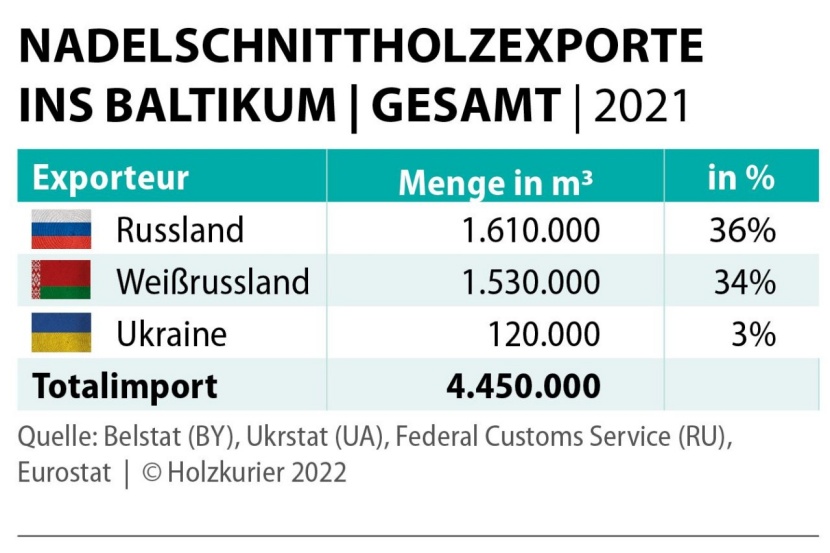
Overall softwood lumber exports from Russia, Belarus and Ukraine to the Baltic States in 2021; in m³; Sources: Belstat (BY), Ukrstat (UA), Federal Customs Service (RU) Eurostat © Holzkurier 2022
Due to their proximity, the Baltic States continue to have very close economic ties to Russia. Last year, the Baltic States bought a total of 4.45 million m³ of lumber, of which 73% were imported from Russia, Belarus and Ukraine. Russia and Belarus supply the vast majority, with 1.61 million m³ (36%) and 1.53 million m³ (34%), respectively.
Estonia in particular is very dependent on its bigger neighbor Russia. In 2021, 57% or 970,000 m³ of the softwood lumber imported by Estonia was bought from Russia.
As for Latvia and Lithuania, the majority of the imported lumber does not come from Russia, but from Belarus. Lithuania only imported around 22% or 280,000 m³ from Russia, while Belarusian softwood lumber accounts for more than half, that is 650,000 m³, of overall imports. The situation is nearly the same in Latvia where 25% (370,000 m³) are bought from Russia and 50% (750,000 m³) from Belarus.
Update: March 10, 14:20 p.m.
Italy, nearly 10% of lumber imports from Russia, Belarus and Ukraine
Flagge Italien/Italy/Italia © Holzkurier
According to Eurostat, Italy imported 4.08 million m³ of softwood lumber and planed timber in 2021. Russia, Belarus and Ukraine accounted for 9% of overall imports. According to data published by the respective national statistical offices, Russia exported 170,000 m³ (4% of overall imports) to Italy, while Belarus shipped 40,000 m³ (1%) to Austria’s neighbor and Ukraine 180,000 m³ (4%). Ukraine in particular exports a lot of special lumber for EPAL pallets to Italy, which is said to satisfy demand to a considerable extent.
Update: March 10, 13:24 p.m.
No timber exports from Russia to the EU and North America until the end of 2022
The ban on exports affects countries on Russia’s recently published list of “unfriendly” countries, which includes the US and EU countries. According to the Russian Ministry of Industry and Trade, the ban will make sure that the domestic market’s demand for affordable raw wood can be met, in addition to further boosting wood processing in Russia, as lesprom.com reports.
Birch cellulose and wood chips are important raw materials for the EU, according to a statement by the Ministry. 10 to 15% of Finnish cellulose and wood chip consumption is satisfied through imports from Russia. The Ministry considers it impossible to replace all of these imports at once.
The statement of the Russian Ministry is a reaction to numerous European companies refusing to buy wood and wood products from Russia. At the same time, certification bodies FSC and PEFC announced the suspension of trading certificates for wood and wood products from Russia.
Update: March 10, 12:05 p.m.
Around one quarter of German softwood lumber imports from the conflict region

Flag Germany © Holzkurier
Last year, Germany imported around 5.2 million m³ of softwood lumber.
750,000 m³ (14%) of overall imports came from Russia. Another half million of cubic meters were imported from Belarus (350,000 m³; +7%) and Ukraine (140,000 m³; +3%). For Germany, Russia is mostly a supplier of higher-quality lumber, while a lot of packaging wood is imported from Belarus and Ukraine.
Sources: Belstat (BY), Ukrstat (UA), Federal Customs Service (RU) and Eurostat.
Update: March 8, 08:09 a.m.
War in Ukraine adds to the volatility of the US lumber market
Since the outbreak of the coronavirus pandemic, the US Lumber Futures have experienced a wild ride, reaching a record high of US-$1,711/1,000 bft in May last year. After they had plummeted in the spring and summer, the Lumber Futures recovered and received a new boost from the war in Ukraine. Since the Russian invasion of Ukraine, prices have risen by 14% to US-$1,452/1,000 bft. According to the internet platform markets.businessinsider.com, they are now only 15% below the all-time high.
Furthermore, even bigger fluctuations are possible since yesterday. Stock exchange operator CME Group is expanding the daily trading limits for lumber by 90% on March 7. This means that the prices can now go up or down by a daily maximum of US-$57/1,000 bft and US-$86/1,000 bft on the following day, if the previous one closes with prices near the upper limit, as the internet platform reports.
Update: March 7, 14:06 p.m.
Belarus, 2.5 million m³ of softwood lumber to the EU
In 2021, Belarus exported 2.57 million m³ of softwood lumber to the EU. This corresponds to a decrease of 18% compared to 2020.
The most important export markets were Latvia (747,000 m³; +14%), Lithuania (654,000 m³; -30%) and Germany (355,000 m³; -22%), as data published by Belstat, the National statistical committee of The Republic of Belarus, show.
| Exports to the EU only, volumes in 1,000 m³ | |||
| Country | 1–12 2020 | 1–12 2021 | Diff. in % |
|---|---|---|---|
| Latvia | 654 | 747 | 14 |
| Lithuania | 940 | 654 | –30 |
| Germany | 455 | 355 | –22 |
| Poland | 400 | 216 | –46 |
| Netherlands | 194 | 161 | –17 |
| Belgium | 172 | 142 | –17 |
| Estonia | 118 | 126 | 7 |
| Romania | 57 | 47 | –18 |
| Italy | 45 | 36 | –20 |
| Sweden | 11 | 26 | 136 |
| Other countries | 85 | 56 | –34 |
| Total | 3,132 | 2,565 | –18 |
Update: March 7, 08:30 a.m.
Metsä temporarily closes down its Russian sawmill
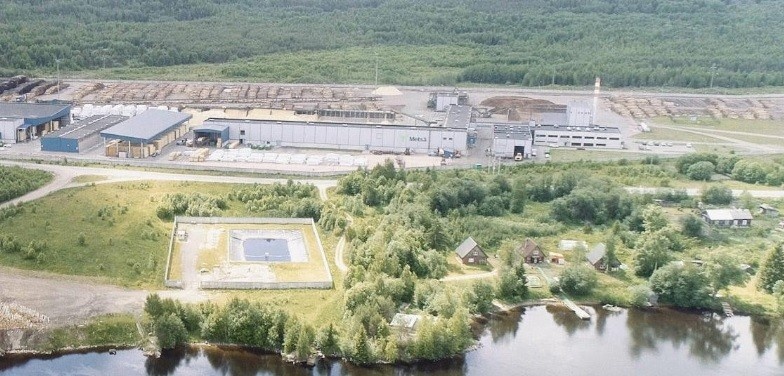
© Metsä
Finnish Metsä Group temporarily closed down its only Russian sawmill. Located close to the border between Finland and Russia, the sawmill produces 285,000 m³ of lumber a year and employs around 115 staff. More than 95% of the lumber produced in the sawmill is exported. Metsä Group also discontinued wood imports from Russia to its Finnish and Swedish sawmills.
Update: March 7, 07:55 a.m.
Timber from Russia and Belarus “conflict timber” according to the PEFC

Timber originating from Russia and Belarus can no longer be used in PEFC-certified products © PEFC International
In an extraordinary meeting which was held on March 4, the Board of PEFC International declared all timber originating from Russia and Belarus to be so-called “conflict timber” which means that it can no longer be used in PEFC-certified products.
According to the PEFC Chain of Custody standard, “conflict timber” is a “controversial source” (PEFC ST 2002:2020 3.7), which cannot be used in PEFC certified product groups (PEFC ST 2002:2020 Appendix 1 6.1). “Conflict timber” is defined as “timber that has been traded at some point in the chain of custody by armed groups, be they rebel factions or regular soldiers, or by a civilian administration involved in armed conflict or its representatives, either to perpetuate conflict or take advantage of conflict situations for personal gain” (PEFC ST 2002:2020, 3.6).
Update: February 28, 3:33 p.m.
Europe received 1 million m³ of Ukrainian softwood lumber
In 2021, Ukraine exported 1.114 million m³ of softwood lumber to Europe, as UKRSTAT reports. This corresponds to a year-on-year increase of 1.7% (2020: 1.096 million m³). Main buyer Hungary received 309,000 m³, recording a 4.5% decrease compared to 2020.
Ukrainian softwood lumber shipments to Italy rose by 1% to 134,000 m³, while those to Germany totaled 136,000 m³ in 2021 and were thus up by 14% compared to 2020. Exports to Romania fell sharply by 49% to 104,000 m³. Austria received 9,000 m³ of softwood lumber from Ukraine in 2021, which is 34% more than in the year before (2020: 7,000 m³).
| in m³ | |||
| Country | 1–12 2020 | 1–12 2021 | Diff. in % |
|---|---|---|---|
| Hungary | 323,474 | 308,814 | –4.5 |
| Italy | 181,630 | 183,517 | 1.0 |
| Germany | 119,000 | 136,176 | 14.4 |
| Romania | 206,258 | 104,284 | –49.4 |
| Poland | 75,245 | 72,254 | –4.0 |
| Lithuania | 7,434 | 58,938 | 692.8 |
| Netherlands | 44,204 | 53,596 | 21.2 |
| Latvia | 14,741 | 49,523 | 235.9 |
| Belgium | 27,351 | 46,290 | 69.2 |
| Czech Republic | 43,098 | 37,196 | –13.7 |
| Slovakia | 21,060 | 21,912 | 4.1 |
| Estonia | 8,866 | 16,473 | 85.8 |
| Austria | 6,636 | 8,881 | 33.8 |
| Spain | 3,326 | 5,685 | 70.9 |
| France | 3,552 | 3,545 | –0.2 |
| Greece | 5,797 | 2,793 | –51.8 |
| Cyprus | 764 | 1,490 | 95.1 |
| Bulgaria | 2,145 | 1,365 | –36.4 |
| Sweden | 33 | 275 | 732.2 |
| Croatia | 388 | 268 | –31.0 |
| Denmark | 689 | 220 | –68.0 |
| Finland | 120 | 209 | 73.7 |
| Portugal | – | 126 | – |
| Ireland | – | 62 | – |
| Slovenia | 42 | 51 | 21.5 |
| Total | 1,095,853 | 1,113,945 | 1.7 |
Update: February 28, 2:57 p.m.
4.5 million m³ of softwood lumber from Russia
Europe is one of the main markets for Russian softwood lumber. Last year, exports to the west grew by nearly 20% compared to 2020. The main buyer of Russian softwood lumber is one of its neighboring countries in the north-west: Estonia received around 966,000 m³ in 2021 and thus 29% more than in 2020. The other two Baltic States Latvia (+51%; 365,000 m³) and Lithuania (+74%; 283,000 m³) also bought significantly more Russian softwood lumber in 2021.
With a volume of 753,000 m³, Germany is Russia’s second most important market for softwood lumber. In 2021, Austria’s northern neighbor bought 17% more than in the year before. Austria itself is only in tenth place of the European ranking with a total of 146,000 m³. All the export markets which follow Austria, starting with Poland, bought less than 50,000 m³ from Russia last year.
Despite a decrease of 11%, Finland was one of the most important markets for Russian softwood lumber in 2021 as well. With a total of 676,000 m³, it ranked third among the European importing countries.
| Exports to the European Union, in m³ | |||
| Country | 1–12 2020 | 1–12 2021 | Diff. in % |
|---|---|---|---|
| Estonia | 751,000 | 966,000 | 28.6 |
| Germany | 645,000 | 753,000 | 16.7 |
| Finland | 756,000 | 676,000 | –10.6 |
| Netherlands | 358,000 | 395,000 | 10.3 |
| Latvia | 242,000 | 365,000 | 50.8 |
| Lithuania | 163,000 | 283,000 | 73.6 |
| France | 279,000 | 272,000 | –2.5 |
| Belgium | 144,000 | 221,000 | 53.5 |
| Italy | 97,000 | 167,000 | 72.2 |
| Austria | 143,000 | 146,000 | 2.1 |
| Poland | 30,000 | 48,000 | 60.0 |
| Czech Republic | 43,000 | 48,000 | 11.6 |
| Ireland | 17,000 | 30,000 | 76.5 |
| Denmark | 21,000 | 29,000 | 38.1 |
| Greece | 9,000 | 19,000 | 111.1 |
| Romania | 10,000 | 14,000 | 40.0 |
| Sweden | 4,000 | 11,000 | 175.0 |
| Spain | 16,000 | 9,000 | –43.8 |
| Hungary | 11,000 | 9,000 | –18.2 |
| Slovenia | 4,000 | 7,000 | 75.0 |
| Cyprus | 3,000 | 5,000 | 66.7 |
| Portugal | 2,000 | 4,000 | 100.0 |
| Slovakia | 2,000 | 3,000 | 50.0 |
| Bulgaria | 2,000 | 1,000 | –50.0 |
| Total | 3,750,000 | 4,482,000 | 19.5 |


