
The world's twelve biggest producer countries succeeded in exporting almost 126 million m³. Year-on-year, this is an increase of 3.5 million m³. Timber-Online has been surveying global trade flows since 2015 - and the medium-term comparison is even more impressive: Compared to 2015, the increase rate is 13% to 15 million m³.
Russia: Shooting star (thanks to China)
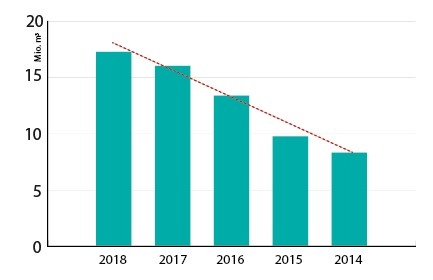
Development of softwood lumber exports from Russia to China (in million m3) © Timber-Online
The shooting star amongst the softwood lumber exporting nations remains Russia. With a growth rate of 8% per year, the country has been gaining traction since 2014. From 21.6 million m³, Russia's export volume rose to a total of 30 million m³ in 2018 already, more than half of which (17 million m³) went to China. Within four years, the supply stream from Russia to China grew from 8.3 million m³ (2014) to now 17.3 million m³ last year. And there is no end in sight: Until August, exports to China gained yet another 15%. Germany's softwood lumber exports amounted to 8.2 million m³ last year. This is 10% more than in 2017, which represents the highest value since then.
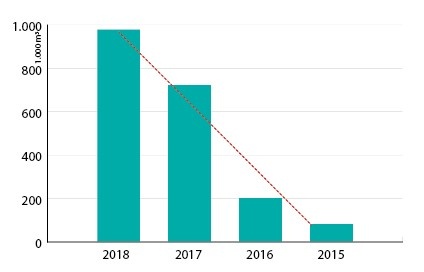
Development of softwood lumber exports from Germany to the USA (in 1,000 m³) © Timber-Online
These considerable increases are due to two reasons: the high damaged wood accrual and the very good market situation in the United States up until mid-2018. Within four years, German exports to the US blew up from 80,000 m³ in 2014 to almost 1 million m³ last year (+1096%).
Best results since 2010
An increase of 9% was observed for Austrian exports in 2018. This marks the biggest export success since 2010. The significant difference to German export markets is that Austria supplies less volatile markets. Top customer Italy is consolidated in terms of volume. Deliveries to stable customer Germany come in second, and only then overseas markets such as the MENA region and Japan follow. In other words: Destinations are chosen much more conservatively compared to the big German exporting sawmills.
In contrast to Central European countries, Sweden's exports declined in 2018. The country's eight most important receiving countries bought less last year. While main customers Great Britain and Netherlands remained comparatively stable, deliveries to Egypt (-30% to 900,000 m³) collapsed.
If monkeys sold lumber
"Even monkeys could run the business" was a rather scornful take on the export managers' job last year. But it isn't quite as simple. The motto seems to be: Skyrocketing increases can very well also entail the same in declines. In the second half of last year at the latest, the first dark clouds appeared on the sales sky. In the United States, it even was a whole thunderhead, and the slump in demand as well as the price deterioration from June 2018 onwards were enormous: Canadian exporters alone lost a sales volume of 1.5 million m³ on the US market. The price was almost halved from €400/m³ in May to €226/m³ in December.
Collapse in China
A parallel development, even if not to the same absolute extent, reported Finnish exporters on the Chinese market. From the 1.7 million m³ of annual sales in 2017, volumes going to CHina This ruined the annual profit of the Finnish sawmill industry in 2018: Finnish exports dropped by 9% to 8.6 million m³. The decline of 700,000 m³ exactly corresponds to the losses in China.
Canada, Stora Enso and Schweighofer
Behind the two big import giants, the United States and China, Japan comes in third on the world markets with an annual demand of about 5.7 million m³. Japan is of paramount importance for Canada and two European timber businesses: Stora Enso and Holzindustrie Schweighofer. On the volatile world market, Japan most recently was a beacon of stability in terms of volume: Imports have been oscillating around the 6 million m³ mark per year. The time when the country still had demand for 8 million m³ was twelve years ago. This level is not realistic anymore.
With 5.4 million m³ of imports, Great Britain snuck its way up to fourth place for a year on the global market of 2017. Last year, the country went back to fifth place giving rank four back to Germany (4.8 million m³ of imports). In 2010, an annual consumption of 4.5 million m³ was registered for Great Britain.
Stable at a low level: Italy
Italy remained stable and came in 6th in 2018. The country's softwood lumber demand settled around 3.9 million m3/yr (average value: 2014-2018). The fact that in the mid-2000s the level was 6.5 million m³/yr is merely a historical memory now. As Eurostat figures for last year indicate, 51% of Italy's demand was covered with Austrian goods. Only three years earlier, Austria's supply share was at a consistent 60%. Consulting figures provided by Statistics Austria, on the other hand, Austria's share last year was still at a much higher level: 61% (2.6 million m³ delivered goods in 2018).
The MENA region received the exact same amount in 2018 as in 2017 from top export countries: 10.5 million m³. The most important supplier for this region was Finland (2.86 million m³), followed by Russia (2.54 million m³), Sweden (2.5 million m³), Austria (890,000 m³) and Germany (660,000 m³).
| Trade matrix of softwood lumber flows 2018. Export volumes are given in 1,000 m³ from the 12 biggest exporting nations into the 15 most important importing countries as well as the MENA region. Sources are national softwood lumber export statistics of 2018 (as of September 2019). | |||||||||||||||||||
12 biggest exporting nations |
15 biggest importing nations | ||||||||||||||||||
|---|---|---|---|---|---|---|---|---|---|---|---|---|---|---|---|---|---|---|---|
| Countries | Total | 1. USA | 2.China | 3.Japan | 4.Germany | 5.UK | 6.Italy | 7.Egypt | 8.Nether-lands | 9.Uzbekistan | 10.Austria | 11.France | 12.Süd-korea | 13.Mexico | 14.Algeria | 15.Saudi Arabia | Other countries | MENA | |
| 1. Canada | 41,176 | 32,054 | 5,144 | 2,183 | 9 | 37 | 6 | 7 | 10 | 0 | 1 | 9 | 218 | 60 | 0 | 45 | 1,392 | 129 | |
| 2. Russia | 29,951 | 28 | 17,297 | 859 | 530 | 367 | 101 | 1,230 | 393 | 2,588 | 107 | 289 | 421 | 0 | 0 | 17 | 5,725 | 2,540 | |
| 3. Sweden | 12,232 | 372 | 627 | 723 | 790 | 2,556 | 72 | 901 | 952 | 0 | 51 | 323 | 96 | 0 | 533 | 306 | 3,930 | 2,493 | |
| 4. Finland | 8,662 | 27 | 1,,070 | 919 | 511 | 910 | 124 | 1,280 | 264 | 0 | 129 | 482 | 59 | 0 | 518 | 231 | 2,137 | 2,862 | |
| 5. Germany | 8,242 | 978 | 177 | 89 | 0 | 493 | 494 | 8 | 904 | 0.002 | 897 | 839 | 147 | 1 | 68 | 130 | 3,017 | 660 | |
| 6. Austria | 5,969 | 186 | 50 | 305 | 1,026 | 56 | 2,608 | 6 | 2 | 0.01 | 0 | 59 | 70 | 0 | 360 | 75 | 1,165 | 890 | |
| 7. USA | 3,871 | – | 677 | 221 | 9 | 14 | 14 | 31 | 28 | 0 | 0.3 | 8 | 7 | 670 | 5 | 1 | 2,185 | 54 | |
| 8. Czech Repbulic | 3,759 | 46 | 74 | 136 | 990 | 41 | 561 | 0 | 16 | 0 | 983 | 2 | 82 | 0 | 0 | 3 | 825 | 7 | |
| 9. Chile | 3,379 | 261 | 722 | 319 | 0.01 | 3 | 0.1 | 0 | 1 | 0 | 0 | 0 | 538 | 261 | 0 | 178 | 1,097 | 372 | |
| 10. Belarus | 3,309 | 0 | 52 | 2 | 651 | 4 | 40 | 3 | 195 | 46 | 2 | 23 | 1 | 0 | 0 | 0 | 2,291 | 26 | |
| 11. Ukraine | 3,181 | 1 | 481 | 3 | 241 | 6 | 226 | 9 | 57 | 3 | 22 | 2 | 106 | 0 | 0 | 12 | 2,011 | 217 | |
| 12. Brazil | 3,106 | 1,176 | 383 | 1 | 1 | 1 | 1 | 0 | 0.1 | 0 | 0.004 | 2 | 20 | 513 | 0 | 214 | 795 | 401 | |
| Total | 126,838 | 35,128 | 26,753 | 5,761 | 4,758 | 4,489 | 4,248 | 3,474 | 2,822 | 2,637 | 2,192 | 2,040 | 1,763 | 1,505 | 1,484 | 1,213 | 26,572 | 10,521 | |
Method
The trade matrix contains the world's twelve biggest softwood lumber exporters and the 15 biggest importers. Additionally, the MENA region is listed separately.
The basis are national export statistics from 2018. The inquiry included softwood lumber including planed goods. To avoid confusion of softwood lumber with other products, the search was performed according to the Harmonized System Code (HS code) for softwood lumber. According to the World Customs Organization, this grade is defined as a six-digit code, as of 2017 "440711, 440712, and 440719".
Timber-Online defines the MENA region as follows: Egypt, Algeria, Syrian Arab Republic, Ethiopia, Bahrain, Iraq, Islamic Republic of Iran, Israel, Yemen, Jordan, Qatar, Kuwait, Lebanon, Libya, Morocco, Oman, Saudi Arabia, Sudan, Tunisia, as well as United Arab Emirates.


