
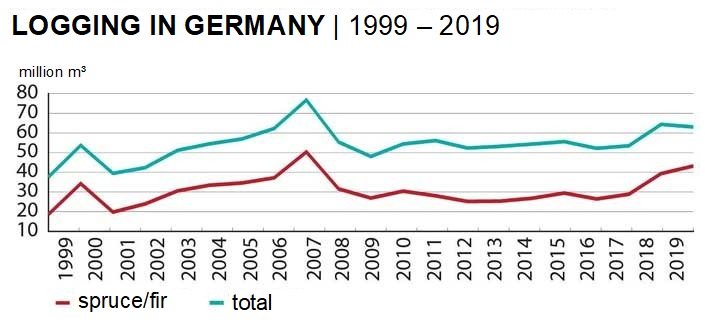
With spruce in particular, harvesting again saw a marked increase of 10% to 43.2 million m³. Compared to 2018, the volume grew by 4 million m³. The development is even more remarkable in comparison with the ten-year average (2009 to 2018) when logging was at 28.7 million m³. This means that spruce harvest was 51% higher in 2019.
The volume of damaged wood of all types of wood rose from 31.9 million m³ in 2018 to 42.6 million m³ in 2019, i.e. by 33% year on year. Spruce harvest in particular was driven by damaged wood. In this group of tree species (spruce/fir/Douglas fir), 83% of the overall harvest volume was damaged wood. In total, 36 million m³ were harvested.
Destatis’s figures on damaged wood are considerably lower than those projected by the Federal Ministry of Food and Agriculture in November 2019. The Ministry predicted a total of 70 million m³ of damaged wood in 2019.
With all other groups of tree species, i.e. oak (1.5 million m³; -24%), beech (9.2 million m³; -16%) and pine/larch (9.1 million m³; -25%), harvest decreased in 2019. The percentage of damaged wood of all types of wood was 67% (42.5 million m³) last year.
| Year | Oak | Beech | Pine/Larch | Spruce/Fir | Total |
|---|---|---|---|---|---|
| 2019 | 1,523 | 9,202 | 9,109 | 43,226 | 63,059 |
| 2018 | 2,004 | 10,909 | 12,086 | 39,363 | 64,362 |
| 2017 | 1,948 | 10,649 | 12,017 | 28,878 | 53,491 |
| 2016 | 2,135 | 11,007 | 12,574 | 26,478 | 52,194 |
| 2015 | 2,079 | 11,484 | 12,564 | 29,486 | 55,613 |
| 2014 | 2,211 | 12,017 | 13,293 | 26,834 | 54,356 |
| 2013 | 2,245 | 12,071 | 13,533 | 25,359 | 53,207 |
| 2012 | 2,050 | 11,824 | 13,254 | 25,210 | 52,338 |
| 2011 | 2,188 | 12,244 | 13,611 | 28,099 | 56,142 |
| 2010 | 1,802 | 10,176 | 11,995 | 30,445 | 54,418 |
| 2009 | 1,688 | 9,336 | 10,110 | 26,940 | 48,073 |
| 2008 | 2,089 | 10,525 | 11,177 | 31,576 | 55,367 |
| 2007 | 2,135 | 10,981 | 13,235 | 50,377 | 76,728 |
| 2006 | 2,484 | 10,320 | 12,279 | 37,207 | 62,290 |
| 2005 | 2,202 | 8,802 | 11,352 | 34,590 | 56,946 |
| 2004 | 2,017 | 8,668 | 10,345 | 33,475 | 54,505 |
| 2003 | 2,068 | 8,786 | 9,771 | 30,557 | 51,182 |
| 2002 | 1,562 | 7,640 | 9,200 | 23,977 | 42,380 |
| 2001 | 1,819 | 8,957 | 8,896 | 19,810 | 39,482 |
| 2000 | 1,677 | 8,747 | 9,021 | 34,265 | 53,710 |
| 1999 | 1,456 | 8,269 | 9,246 | 18,665 | 37,636 |


